Confocal Microscope Image of Fixed Mouse Embryonic Fibroblast (MEF) Cells
Actin proteins (stained red) and Tubulin proteins (stained green) are involved in a number of cellular process such as cell motility, cell division and maintenance of cell shape. Both proteins form dimers which form micofilaments (actin) and microtubules (tubulin). They are potential targets for cancer therapy. Cells prepared and imaged by Dr. Luanna Scheffer, laboratory of Dr. Jairaj Acharya, CCR, FNLCR

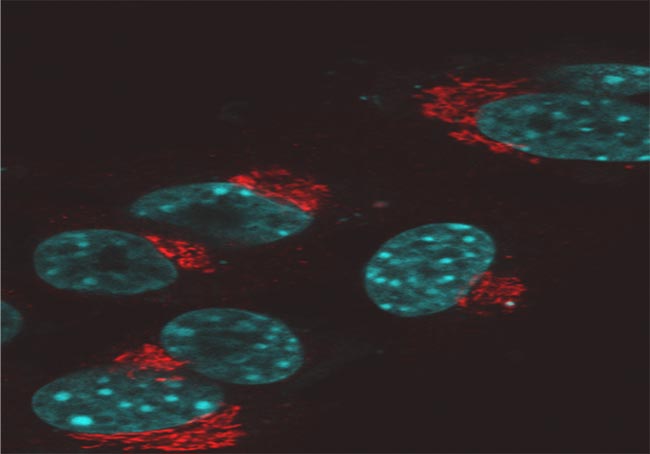
Confocal Microscope Image of Fixed Mouse Embryonic Fibroblast (MEF) Cells
The golgi complex (stained red) and the nucleus (stained cyan). The golgi complex modifies, sorts, and packages proteins for cell secretion or use inside the cell. It also plays roles in lipid transport, lysosome creation and proteoglycan synthesis. Samples prepared and imaged by Dr. Luana Scheffer, laboratory o f Dr. Jairaj Acharya, CCR, FNLCR.
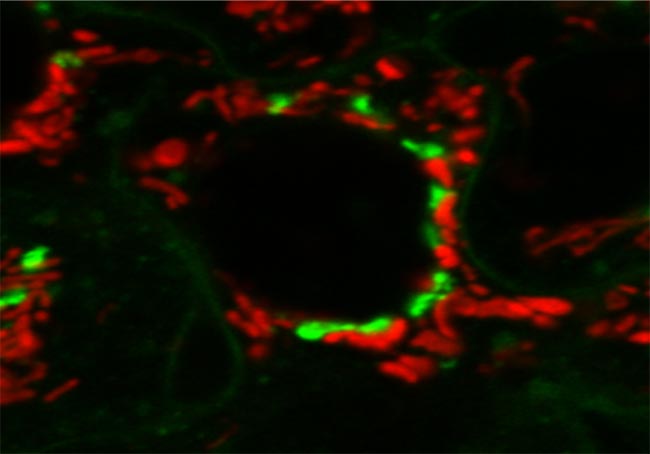
Confocal Microscope Image of Live Mouse Embryonic Fibroblast (MEF) Cells
The golgi apparatus (stained green) modifies, sorts and packages proteins for cell secretion or use inside the cell. It also plays roles in lipid transport, lysosome creation and proteoglycan synthesis. Mitochondria (stained red) converts energy into forms that are usable by the cell. It plays roles in cellular respiration as well as cell division, growth and death. Samples prepared and imaged by Dr. Luana Scheffer, laboratory o f Dr. Jairaj Acharya, CCR, FNLCR.
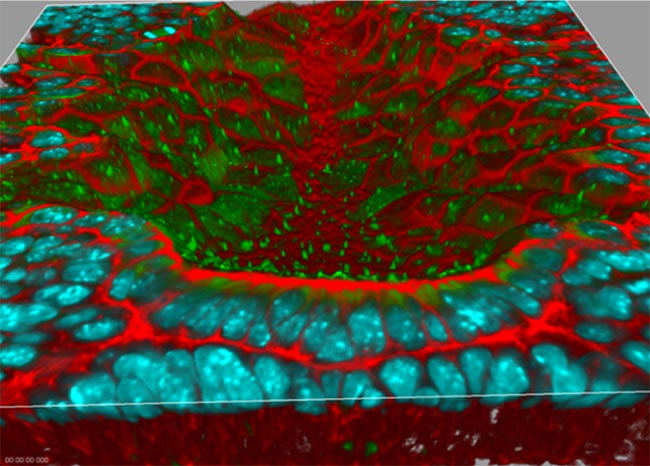
3-D Rendering of the Node of a Mouse Embryo
The red staining is F-actin, the green is antibody labeling of acetylated tubulin to visualize cilia, and the cyan is cell nuclei. The sample preparation and labeling were performed in the laboratory of Dr. Terry P. Yamaguchi, Cancer and Developmental Biology Laboratory, Center for Cancer Research, National Cancer Institute. Image acquisition and 3-D rendering were performed in the laboratory of Dr. Stephen Lockett, Advanced Technology Program FNLCR/SAIC-Frederick.
Confocal Microscope Image of Bovine Pulmonary ArteryEndothelial (BPAE) Cells
(BPAE) cells stained with a combination of fluorescent dyes. Mitochondria were labeled with red-fluorescent MitoTracker Red CMXRos, F-actin was stained using green-fluorescent Alexa Fluor 488 phalloidin, and blue-fluorescent DAPI was used to label the nuclei. Endothelial cells line the blood vessels and provide a barrier between circulating blood and the rest of the vessel wall. Among the processes they are involved in are angiogenesis, vasculogenesis, vasoregulation and blood cell trafficking. Cells are Invitrogen’s FluoCells prepared slide #1 (F36924).
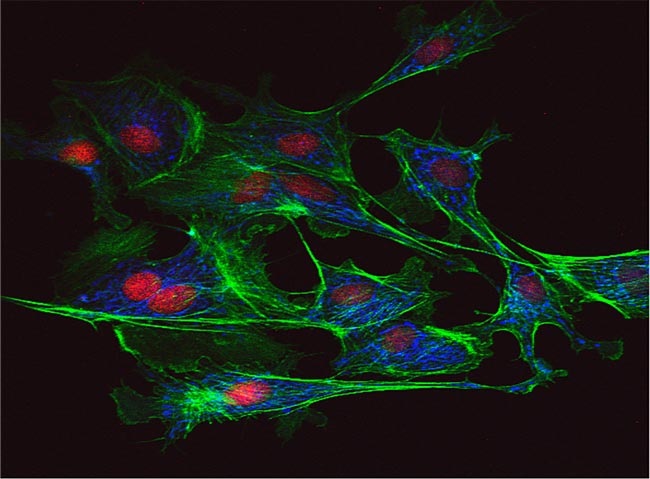
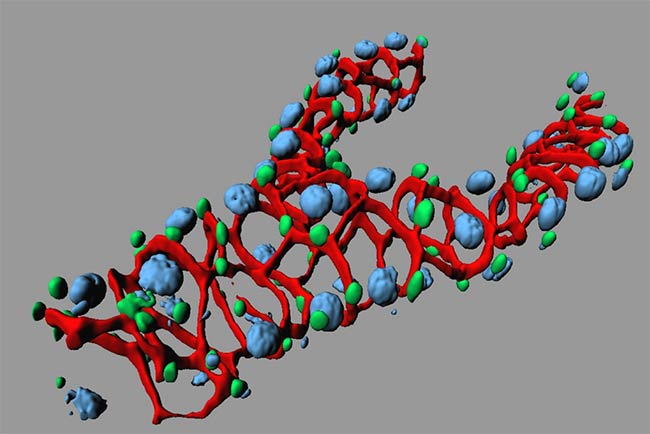
Image of Drosophila Kidney RC Cells
Red channel is antibody-labeled Scrib in RC cells (one of the tumor suppressors in Drosophila) antibody-labeled in Drosophila kidney RC cells; Green is Stat-GFP, which labels the kidney stem cells (RNSC) and transit cells (RB); Blue is DAPI. Sample prepared and images by Dr. Xiankun Zeng, laboratory of Dr. Steven Hou, CCR, FNL and rendered with IMARIS.
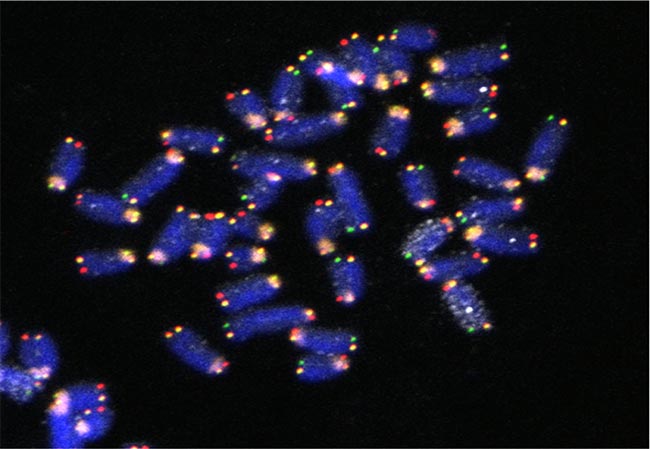
Five-color FISH Imaging in Mouse Embryonic Stem Cells to study Strand Segregation in Chromosome 11 through Mitosis.
DNA (blue), Centromere (orange), Chromosome 11 (white), G repeat Telomeres (green), C repeat Telomere (red). Metaphase spread was prepared so that one sister chromatid is single stranded. Sample prepared and imaged by Dr. Stephen Sauer, laboratory of Dr. Amar Klar, CCR, NCI-Frederick.
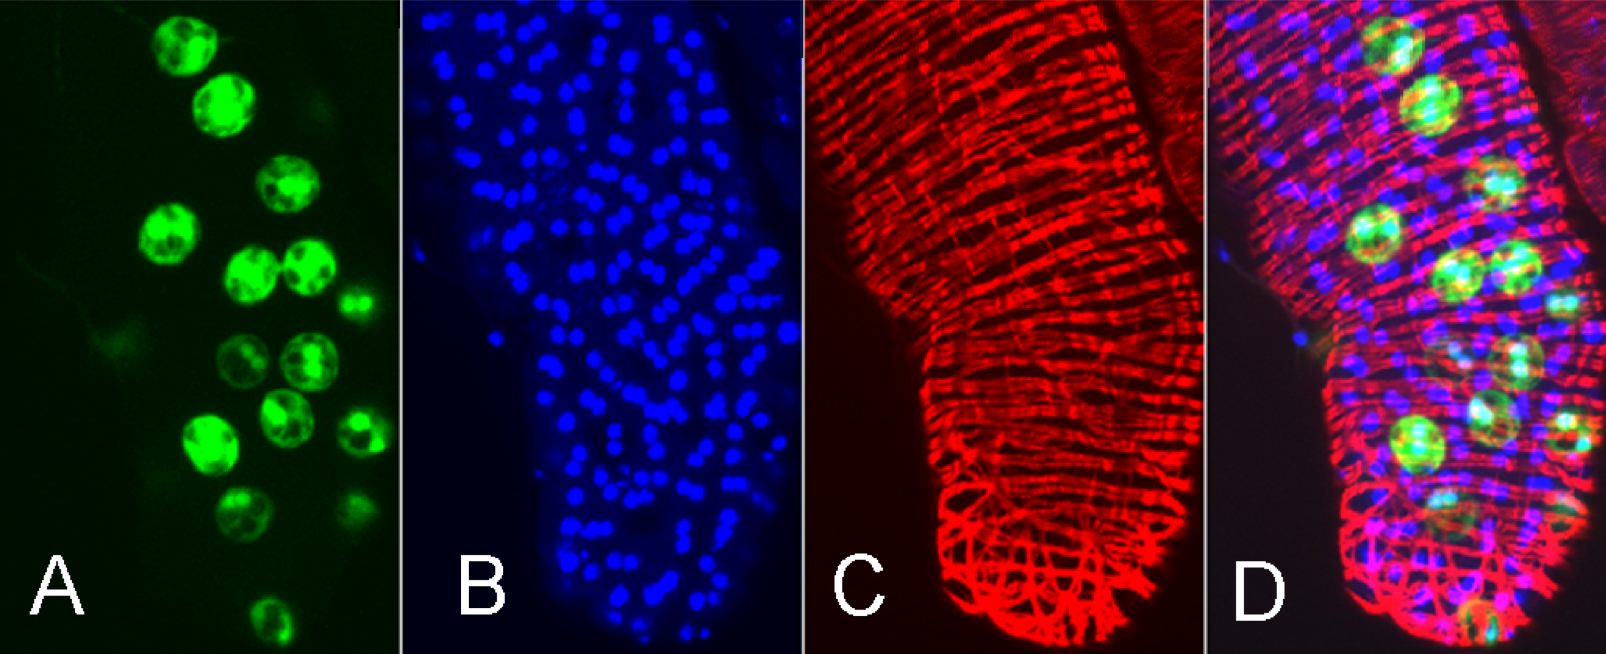
Images of Drosophila Prostate
A) Escargot-GFP labeling a subset of cells. B) DAPI nuclear staining. C) Red: phalloidin labeling of F actin. D) Overlay. Sample prepared and imaged by Dr. Shree Ram Singh, Laboratory of Dr. Steven Hou of CCR, NCI-Frederick (unpublished)
Photo bleaching and recovery of GFP STAT1
This movie is an example of fluorescence recovery after photobleaching (FRAP), which is used to analyze the diffusion of proteins in cells. In this example, GFP-STAT1 is in the cytoplasm of live RIMM cells. STAT1 is a member of the Signal Transducers and Activators of Transcription family of transcription factors. The top movie shows photobleaching of GFP in the top left corner of the cell. After a few seconds, fluorescence recovers in the dark region and fluorescence is lost in the unbleached regions by the process of diffusion. Later on the cell’s GFP re-equilibrates. The diffusion coefficient of the protein can be determined from the rate of the recovery. The bottom half of the movie shows differential interference contrast images of the cell, showing that it is alive and appearing healthy.
Division of MCF 10A cell
This is an example of 4D living cell imaging. The images depict fluorescence labeled cell nuclei of MCF10A cells grown in 3D in matrigel acquired on a Zeiss LSM 510 confocal microscope. Also shown is the DIC image in grey. Each image was taken at a different time point for an overnight duration. Each image shows xy, xz and yz slices through the acquired 3D image. At timepoint 1 showing a single cell. Over the duration of the experiment the single cell divides into 2 cells, then 4 cells and finally forms a spheroid of 8 cells.
Collective Cell Migration
The gap closing assay is used for studying collective cell migration. Cells are grown close to confluence in a coverslip bottomed dish with a spacer of approximately 1 mm wide dividing the coverslip into two halves. The experiment is started by removing the spacer. The first frame in the movie shows the dish just after removal of the spacer. Over time the cell migrate into the space. How fast the space fills up with cells measures cell migration.
